Dear Investor,
Five years ago this month, we launched the Altrinsic Emerging Markets Opportunities strategy. As we take a moment to reflect, the constants are as instructive as the changes.
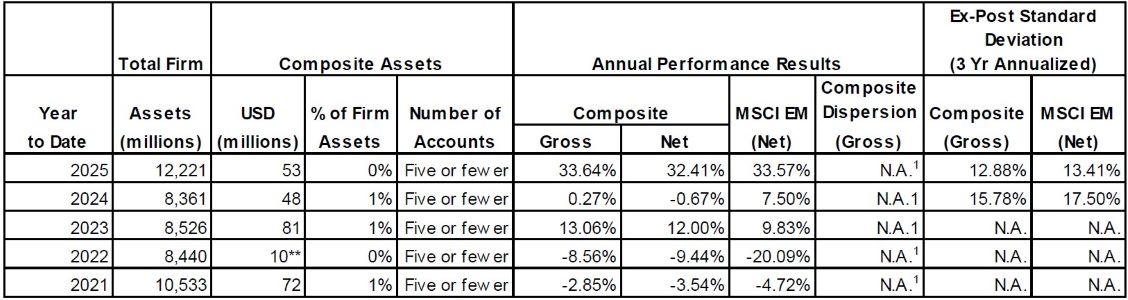
Our core hypotheses about where value resided in emerging markets have held true. Geographic diversification away from benchmark heavyweights, going deeper into the capitalization spectrum, and maintaining exposure to frontier markets have all contributed meaningfully to our results; the portfolio gained 34.9% on a cumulative basis since inception (28.8% net), compared to the 19.9% gain of the MSCI EM Index, as measured in US dollars.i
What has shifted is the map of where we find those opportunities. China, which looked expensive relative to the rest of the emerging landscape at launch, is increasingly offering attractively valued investment opportunities; and Taiwan, a market that attracts enormous attention – among a very narrow set of companies – is yielding ideas off the beaten path. Meanwhile, Vietnam stands at an inflection point – FTSE Russell’s confirmation of its upgrade to Emerging Market status should broaden the institutional base and begin closing the gap between valuations and strong fundamentals.
The EM asset class continues to reward patient, differentiated investors, even as the opportunity set evolves. A detailed Five Years in Review, which dives deeper into the topics outlined above, is included at the bottom of this letter.
Geopolitical turbulence and broad market uncertainty defined the first three months of 2026; through one of the most volatile quarters in the post-pandemic period, emerging market equities (MSCI EM Index -0.2%) held up better than their developed market counterparts (MSCI World Index -3.6%). Meanwhile, the Altrinsic Emerging Markets Opportunities portfolio gained 0.3% gross of fees (0.1% net). Within our portfolio, the resilience of our financials holdings – our largest sector exposure – was noteworthy. Years of quiet structural improvement have produced institutions that are better run, better capitalized, and more durable than the market gives them credit for.
Hidden in Plain Sight: The Case for EM Financials
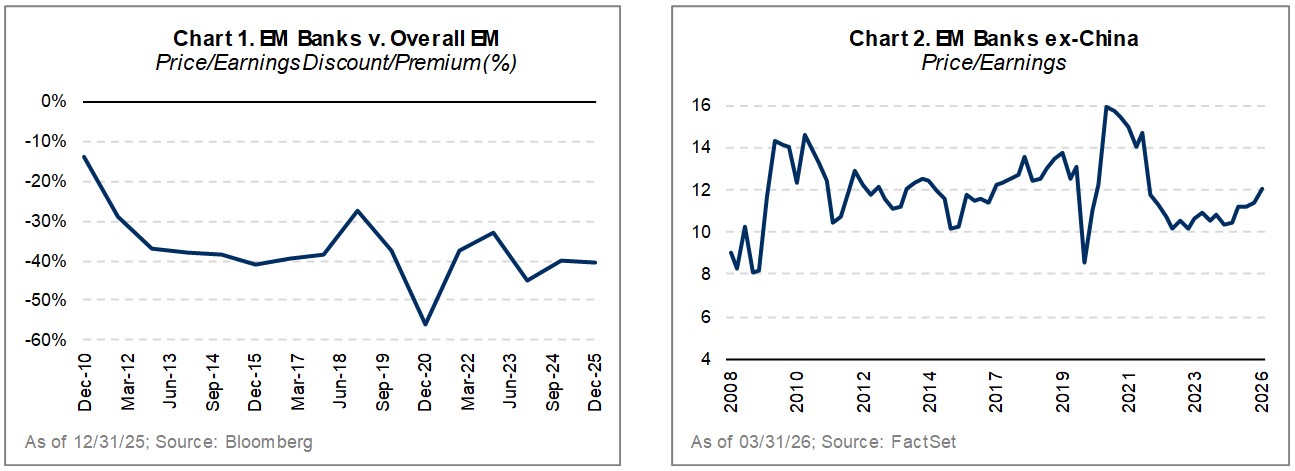
Financials comprise roughly 20% of the MSCI Emerging Markets Index but have been overshadowed by the tech sector’s sharp re-rating – this is the opportunity. The sector is large, liquid, and attractively valued relative to the broader market (Chart 1), and the investment case has evolved. Financial institutions are no longer blunt macro proxies tied to the fate of their domestic economies, but rather increasingly well-run companies with improving business quality. Positioned to capture structural shifts, including elements of economic decoupling, financials offer exposure to more durable and internally driven growth than is widely appreciated.
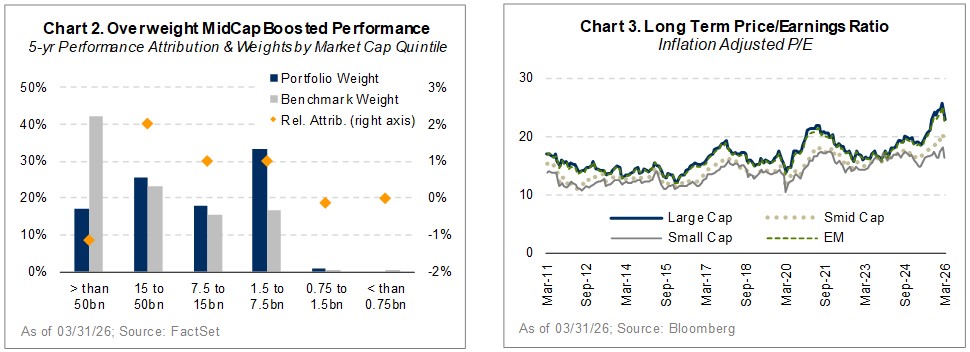
This evolution is reflected in our portfolio: EM financials are our largest sector exposure and a key performance driver since inception. The conventional view of emerging market banks – cyclically fragile, highly regulated, and extremely volatile – has not kept pace with reality. Instead, analyzing EM banks through the lens of financial productivity – including what they earn, how efficient they are, and what leveraged risks they take – reveals institutions that have quietly engineered better businesses. Looking beyond China, which represents nearly 25% of the investable universe, we have uncovered a compelling set of mispriced investments (Chart 2). The market and valuations have yet to fully recognize the more resilient margins, diversified revenue, leaner costs, disciplined risk management and returns driven by genuine asset productivity rather than leverage.
How much do EM banks earn?
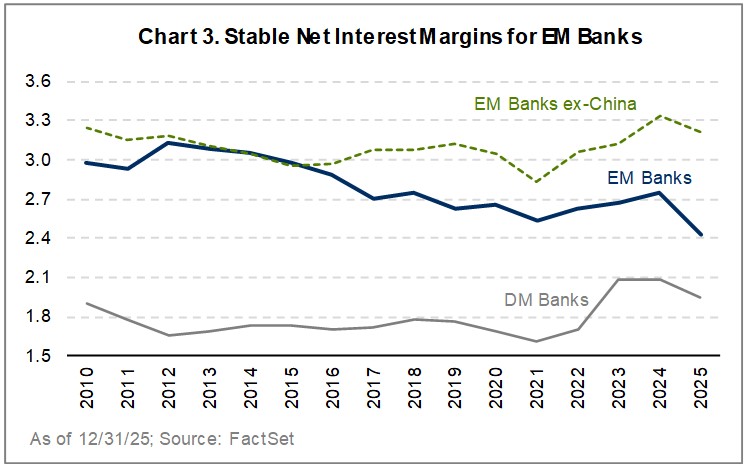
EM bank interest margins have proved resilient and, in many markets, are expanding, while non-interest income is diversifying in ways the market has yet to fully credit.
a) Net Interest Margins (NIM): EM bank NIMs have stayed within a healthy 2.5-3.3% range across fifteen years and multiple rate cycles (Chart 3). The 2021 pandemic trough proved shallow and short-lived, with margins fully recovered by 2023. Excluding China, the picture is even more attractive, as China’s NIM is explicitly managed downward by policy directives.
Three structural forces have supported this trend. First, real interest rates in many emerging markets remain clearly positive, supported by stronger policy frameworks after past currency crises. Second, banks are shifting toward higher-margin lending. Consumer and SME loans now make up a larger share of portfolios and typically earn better spreads than corporate lending; for example, Axis Bank in India increased its retail mix from 40% to 60% of loans over the last decade. Third, funding is improving. Retail deposits provide stable, low-cost funding, especially where payroll-linked banking is common. In Indonesia, Bank Mandiri reflects this, with low-cost CASA funding (current account and savings account) reaching 80% of total deposits by the end of 2024.
b) Non-Interest Income: Non-interest income – including fee, transactional, insurance, and wealth management – held its ground through pandemic-era NIM compression, with fee income proving particularly resilient. Diversifying into fees has become an explicit strategic priority across EM banks as a buffer against rate volatility. Across our quality franchise holdings, non-interest income grew at high single to low double-digit rates, in some cases ahead of system loan growth, suggesting genuine revenue diversification rather than rate tailwinds. Among our holdings, Credicorp, Peru’s largest private financial institution, has increased fee and other income substantially since the pre-pandemic period, driving non-interest income at 6% CAGR. This has proven to be a structural, rather than cyclical, contributor.
How efficient are EM banks?
EM banks have demonstrated structural improvement in both cost efficiency and credit quality. Leaner operating structures driven by digital adoption and branch rationalization, alongside steadily declining credit costs and rising capital buffers, point to fundamentally better-run businesses than the market gives them credit for.
a) Costs and Efficiency: Cost efficiency is one of the most underappreciated structural transformations in the sector. Operating expenditure as a proportion of assets declined consistently from about 2.4% in 2016 to 2.1% by 2024 – despite rising inflation across many EM economies.
Two primary forces drove this trend. Branch rationalisation was an important contributor, as was the younger, more digitally native customer bases across Southeast Asia and Latin America that are faster to adopt a less costly, tech-forward infrastructure and experience. Many of our EM bank holdings – from HDFC and Axis Bank in India to Bank Mandiri in Indonesia, Credicorp in Peru, and Standard Bank in South Africa – have invested heavily in digital capabilities and technology, facilitating increased operating leverage.
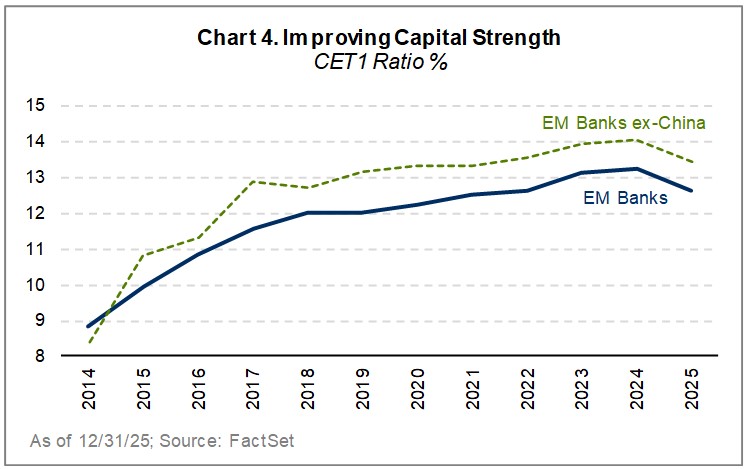
b) Lower Credit Costs, Better Asset Quality: In the post-pandemic period, credit costs have structurally declined, while capital strength, as measured by CET1 ratios,1 has risen from 8.8% in 2014 to a high of 13.2% in 2024 (Chart 4). Corporate balance sheets have strengthened and lending has shifted materially toward local currency, substantially reducing the currency mismatch dynamics that turned earlier regional credit cycles into systemic crises. Axis Bank serves as a strong example of a dramatic credit quality turnaround – credit costs improved from a peak of 3.6% in 2018 to 1% last year.
How much are EM banks borrowing to amplify returns?
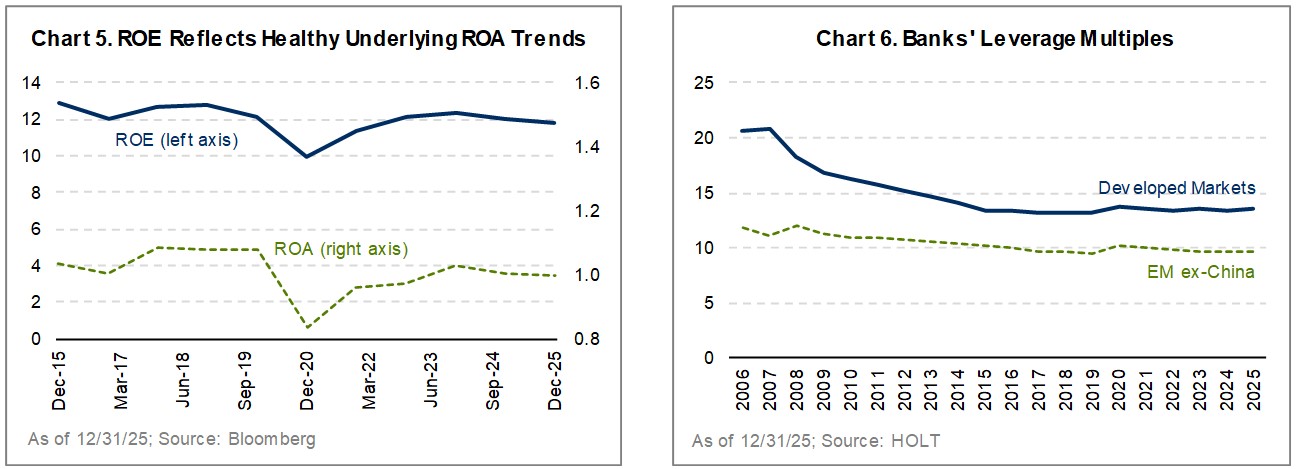
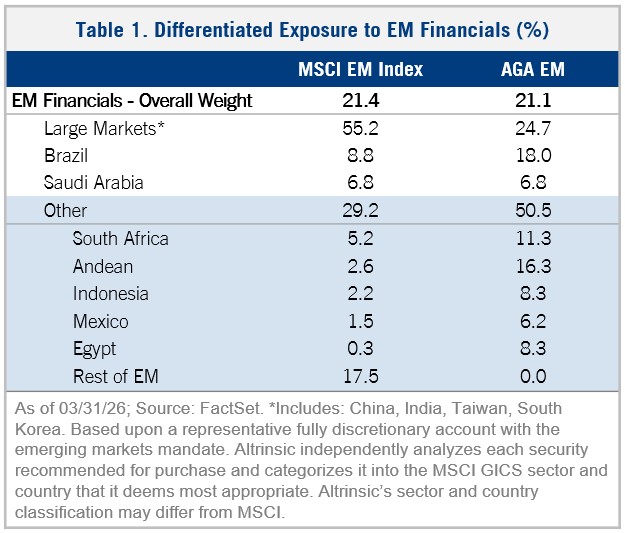
Return on equity across the EM bank universe has recovered from the 2020 trough (Chart 5) and stabilized at levels that are not only competitive on an absolute basis but also being generated meaningfully differently than a decade ago. Leverage multiples across the EM ex. China bank universe have been stable, albeit at half to two-thirds of developed market levels (Chart 6). This is a central component of the sustainability argument; a flat or declining leverage multiple means that the ROE trajectory is driven entirely by ROA. Returns generated through higher asset productivity – more efficient cost structures, better credit quality, diversified revenue – are durable. Returns generated through leverage expansion are not. EM banks are delivering the former but have yet to be rewarded for it in markets.
EM Banks: Undervalued. Underleveraged. Overlooked.
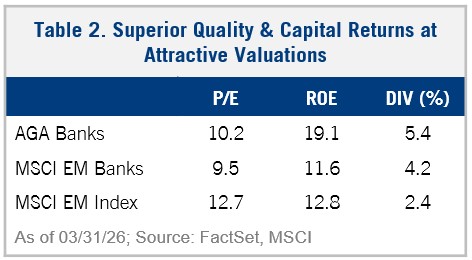
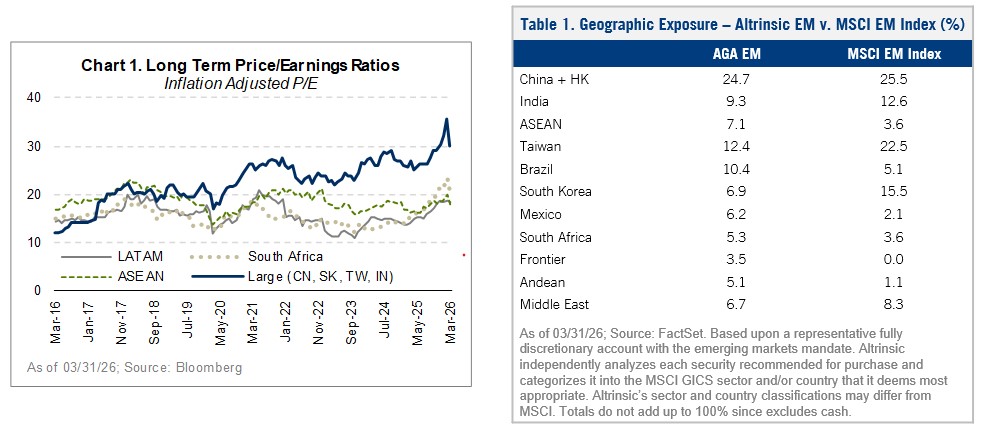
Emerging market banks offer a rare convergence of cheap valuations, structurally improved business quality, and superior income generation – a combination that stands out in sharp contrast to the broader market. EM banks are trading near historical valuation lows yet deliver approximately 50% higher financial productivity and superior dividend income versus the wider EM universe. Looking beyond the benchmark’s China concentration reveals an even richer opportunity set across Asia ex-China and Latin America. Our portfolio reflects this opportunity (Table 1); financials represent our largest sector weight at 21.6%, largely concentrated outside of China where the discount is widest and the productivity and income advantage is most compelling (Table 2).
Performance Review and Investment Activity
The greatest sources of positive attribution in the first quarter were financials (Credicorp, B3, Alinma Bank), consumer discretionary (Lojas Renner, BYD, Americana Restaurants), and communication services (Tencent, Advanced Information Service). Negative attribution came primarily from our relative underweight exposure to, and positions in, information technology (Shenzhen Transsion, Samsung Electronics Co, E-INK Holdings), utilities (Indraprastha, China Resources Gas), and industrials (Voltronic Power, Larsen & Toubro, Grupo Aeropuertorio Pacifico).
From a geographic perspective, gains in China (Ganfeng Lithium Group Co., Tencent, BYD), Mexico (Tenaris S.A., Banorte, FEMSA), and Egypt (Anglogold Ashanti, Commercial International Bank of Egypt) were offset by our underweight exposure to, and select positions in, South Korea (Samsung Electronics, Coway Co, Misto Holdings), specific Taiwanese holdings (Voltronic Power, E-INK Holdings, Hon Hai), and some of our Indonesian stocks that were negatively impacted by a regulatory hurdle from MSCI ratings (Sumber Alfaria, Telkom Indonesia, Bank Mandiri).
Portfolio activity was elevated this quarter, with four buys (Goneo Group, Tata Consulting Services (TCS), Realtek Semiconductor, Silicon2) and one sell (Infosys).
Goneo Group is a Chinese low-voltage electrical supplier with durable market leadership built on product quality, wide distribution, and vertical integration. Their category benefits from electrification, energy efficiency, and safety tailwinds, while certification requirements and installed-base lock-in support pricing power and margins. Despite these strengths, shares have de-rated on cyclical concerns as the market undervalues both Goneo’s competitive moat and its growth potential in new product categories domestically and abroad.
We initiated a position in TCS, India’s largest IT services vendor which is underpinned by a globally recognized brand and a proven ability to deliver complex IT solutions at scale. Over multiple technology cycles, the company has built a diversified set of capabilities enabling it to adapt and capture value from emerging trends. Its current valuation reflects concern around near-term AI headwinds while underestimating longer term opportunities. As IT spending normalizes, growth should recover and drive a multiple re-rating toward historical levels.
We purchased Realtek, a leading Taiwanese semiconductor designer specializing in Wi-Fi, Bluetooth, and Ethernet connectivity. Its capital-light model generates robust free cash flow, supported by secular growth in data network expansion and upgrades. Near-term PC and consumer electronics headwinds have obscured the company’s ability to leverage its design expertise into high-growth verticals including automotive Ethernet and data center networking.
Finally, in South Korea, we initiated a position in Silicon2, a fast-growing global distributor of Korean beauty products that partners with over 200 brands worldwide. It offers a compelling way to capture structural K-beauty growth while limiting single-brand risk through portfolio diversification. We believe the market underappreciates a business that has demonstrated scalable growth and margin resilience via operating leverage and network effects, while China and Japan represent strategic optionality.
We sold Infosys, as we identified a more attractive investment opportunity in TCS, using the proceeds from the sale to fund the purchase.
Durability Forged Through Crisis
Given the severity of the situation in the Middle East, we would be remiss not to comment on its effects and potential outcomes. The circumstances of the conflict pose real short-term risks to growth across many emerging markets, but the fluid nature of the events unfolding makes firm conclusions premature. Much of Asia sources the bulk of its energy from the Middle East – in some cases, nearly all of it. From Bangkok news anchors shedding their suit jackets on air, to fuel rationing headlines in the Philippines and supply hoarding in Vietnam, stagflation – no growth, high inflation – looks like an increasingly possible outcome.
“It’s not what happens to you, but how you react to it that matters.”
– Epictetus
Epictetus came from humble beginnings, rising through hardship to build a philosophy rooted in a simple but powerful distinction: what is within our control, and what is not. Emerging markets have seemingly internalized that discipline, responding to disruption not with paralysis but with resourcefulness and renewed cooperation. We are paying close attention to the activity in the Strait of Hormuz and the deals being struck across emerging markets. The examples below show that South-South trade and EM de-coupling are alive and well, despite the global disruption underway:
- Iran granted safe passage to Philippine supply ships through the Strait of Hormuz (Reuters, 2 April 2026)
- China and Vietnam held high-level talks regarding new energy cooperation and supply chain support (Global Times, 16 April 2026)
- South Africa, which sources roughly 24% of its crude oil from Saudi Arabia, secured Iranian guarantees of safe passage for its cargo ships (Freight News, 19 March 2026)
- Brazil is uniquely positioned to weather rising world oil prices (Associated Press News, 31 March 2026)
One of our holdings, Americana Restaurants (UAE/Saudi Arabia), is a good example of how EM companies have grown well-equipped to manage through crises. Management noted that the day the Iran conflict erupted, they called all hands on deck and were operating from their crisis mode playbook within 24 hours. As we go to print, our Middle Eastern investments have contributed positively to our strategy’s year-to-date performance – through the conflict and despite it.
The near term remains murky, but current events reinforce one of our core strategic beliefs: cooperation across the EM and frontier world – sourcing both supply and demand – is not just viable but also accelerating. Market valuations at a 40% discount to developed markets continue to understate the opportunity, particularly for the durable businesses forged in precisely these kinds of volatile environments.
Concluding Remarks
Volatile quarters have a way of clarifying what matters. The companies that hold up, and even thrive, in environments like the one we are navigating now are typically the ones that have been quietly building better businesses for years: stronger balance sheets, more resilient margins, deeper competitive moats. Those characteristics define many of the investments we own in our portfolio today, and much of what we have owned since April 2021. As we mark five years, we do so with a clear sense of where the opportunity lies and a continued commitment to finding it wherever it lives in this vast and varied asset class.
Sincerely,
Alice Popescu
Five Years in Review – Altrinsic Emerging Markets Opportunities Strategy
We started managing the Altrinsic Emerging Markets Opportunities strategy on April 1, 2021 with an objective to develop a portfolio of high-quality, liquid companies that reflects the DNA of the EM asset class. The portfolio gained 34.9% on a cumulative basis since inception (28.8% net), compared to the 19.9% gain of the MSCI EM Index, as measured in US dollars.i Today, as we assess how our differentiated perspectives and exposures have played out, we find great alignment with our starting hypothesis:
- Capitalize on the Geographic Breadth of EM: We have continuously found undervalued gems in less popular, non-traditional EM countries.
As the default passive benchmark for emerging markets, the MSCI EM Index’s narrow, top-heavy exposure dominated by four countries (China, South Korea, Taiwan, and India) overlooks the rich diversity of smaller economies within EM (Chart 1). Our portfolio companies in “other” markets – Mexico, Egypt, Thailand, and the Andean region – have outperformed and contributed positively over five years, validating our initial view that it was worth looking beyond China to find investment opportunities. Companies domiciled outside the four heavily trafficked countries drove 85% of the portfolio’s long-term outperformance.
Conviction is important, but so is nimbleness, when warranted. Relative to five years ago, the landscape has shifted. We are still finding attractively-valued companies in smaller markets (Indonesia, South Africa, Saudi Arabia), but increasingly, China and Brazil (and to some extent Taiwan) present undervalued opportunities. Our exposures continue to look very different from the index (Table 1).
- Build a Portfolio Representing the Asset Class DNA: We have found more opportunities in the small- and mid-cap space than the index reflects.
Our bottom-up discipline has resulted in the portfolio’s overweight positioning among mid-caps, which have contributed meaningfully to our outperformance since inception. Large-cap EM underperformed the broad index over the past five years, dragged down primarily by Chinese mega-caps, while small and mid-cap companies broadly outperformed (Chart 2). This is even more remarkable given the substantial re-rating of large-cap EM tech since 2024. We continue to find attractive opportunities across capitalization range (Chart 3), which more accurately reflects the DNA of the asset class.
- Take a Differentiated View, from the Bottom Up: Our absolute value approach led us to stock specific winners in a stormy and volatile sector – Chinese real estate – but not all gems are diamonds.
We identified Chinese SOE real estate companies as uniquely undervalued, believing the market was failing to distinguish the resilient from the vulnerable amid Beijing’s indiscriminate regulatory crackdown. That distinction proved real, but insufficient. Our companies survived – solid balance sheets, better governance, returning capital through brutal consolidation – yet failed to compound. Structural demand destruction and a collapse in household confidence proved the dominant driver, regardless of individual company quality. While these contrarian positions in China were a negligible drag on performance, our differentiated overweight real estate exposure overall was a positive return contributor.
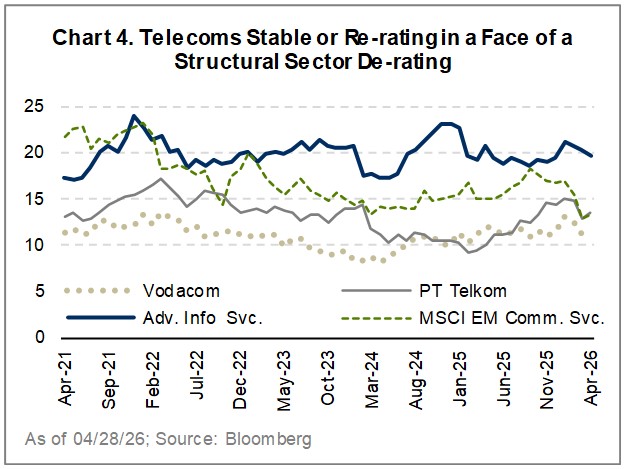
- Express our Contrarian Nature by Looking for Value in the Unloved: While the market chased Chinese internet giants, we identified deeply undervalued and unloved telecom operators in South Africa, Thailand, and Indonesia.
Over the last five years, competitive intensity in the core markets for telecom operators in South Africa (Vodacom), Thailand (Advanced Info Service), and Indonesia (PT Telkom) declined meaningfully, driving margin repair and stronger fundamentals. As gatekeepers of digital infrastructure and regional e-commerce, these companies have also emerged as key enablers of rising data infrastructure demand across ASEAN, attracting regional and international partners. Through disciplined capital allocation and network efficiency, these businesses’ stocks have re-rated against a backdrop of broad sector de-rating (Chart 4). Despite this progress, their improved financial productivity remains undervalued.
- Explore the Frontiers: Our deliberate inclusion of frontier markets has allowed us to identify financially productive businesses at the earliest stages of their evolution toward emerging markets.
Many frontier markets are quietly evolving toward emerging status, and nowhere has this been better validated than Vietnam. The fundamentals are durable: a large, young, literate population; sustained FDI inflows from Asian supply chain diversification away from China; and rising domestic consumption driven by urbanization and digitization. These are structural advantages, not cyclical tailwinds. Vietnamese companies have consistently delivered stronger growth, higher margins, and better asset efficiency than broad EM peers – yet valuations remain below historical medians. That disconnect is the opportunity. FTSE Russell’s confirmation of Vietnam’s upgrade to ‘Emerging Market’ status should broaden the institutional investor base, deepen liquidity, and begin closing a valuation gap that has been unsupported by fundamentals for a long time.
Five years in, our core conviction remains unchanged: emerging markets reward patient, differentiated investors willing to look beyond the crowd. The opportunity set is vast, dynamic, and one of the most compelling in the world.