


Dear Investor,
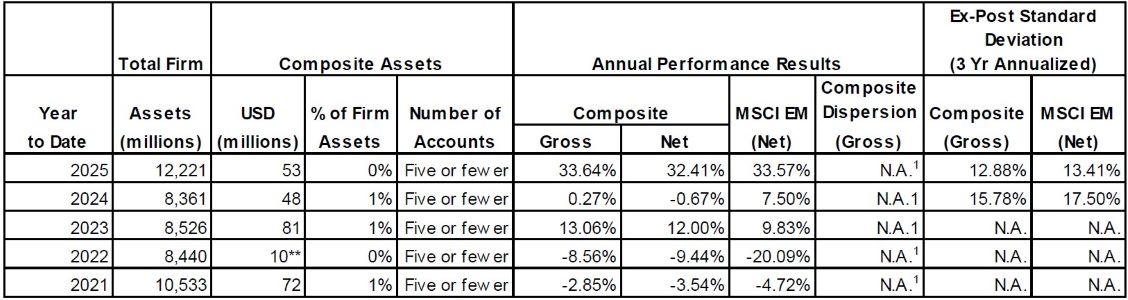
Emerging market equities ended the third quarter modestly lower (MSCI EM (Net) Index -0.4%), masking significant underlying volatility during the period. Technology stocks fell nearly 25% in July when concerns about returns on AI spending, Chinese competition in memory chips, and forced selling by leveraged investors in South Korea hit all at once. Market leadership briefly broadened. Then in August, the tech sector rebounded sharply and leadership narrowed once again as those fears eased, optimism about AI spending returned, and leading South Korean chipmakers signaled more cash returns to shareholders. Against this backdrop, the Altrinsic Emerging Markets Opportunities strategy also declined modestly (-0.6% gross of fees, -0.8% net), as measured in US dollars.i As market concentration returns, we see attractive investment opportunities beyond the largest index constituents.
Perspectives: Risky Business
Absolute risk is rising across global markets, though not evenly. Concentration risk has built up in the EM benchmark, and familiar indicators signal a calm we find hard to trust. At the same time, developed market risk is rising, and the effects could be felt across EM too. It is hard to predict which of the prevailing, or unknown, risks will have the greatest consequences, when those consequences will be felt, or how far they will extend. Our discipline seeks to determine how well our companies are prepared and whether we are being adequately compensated for the risks we take, no matter which comes first and when it hits.
A Narrow Summit
The momentum we flagged in our 2Q26 letter eased early in the third quarter, but we were subsequently reminded how quickly it can return.
“Mountaintops are small, and the air is thin for a reason, because you’re not supposed to dwell on top of the mountain.”
– Jill Ellis, US Women’s National Team Soccer Coach, The Playbook (Netflix, 2020)
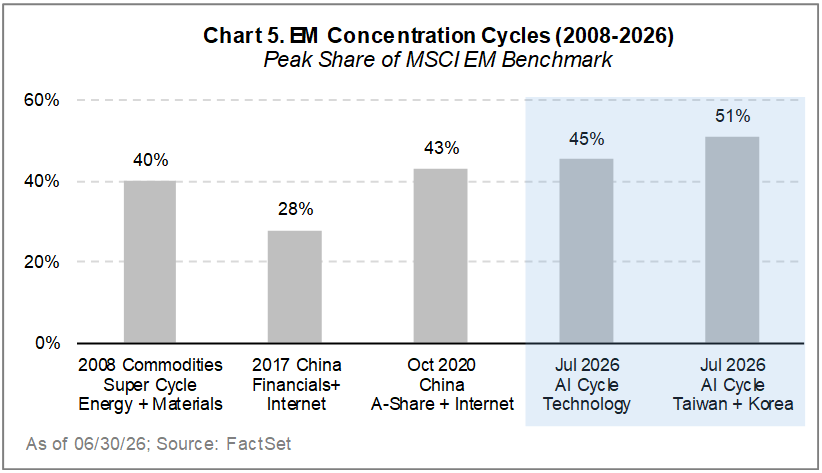
Market concentration has hit its highest level in a generation. Three semiconductor and hardware companies have driven over 70% of the index’s returns year-to-date and now account for roughly 30% of the index. The technology sector, now representing 44% of the index, has surpassed China’s peak weight in 2020. Taiwan and South Korea combined exceed 50%.1 When so much capital follows so few investments, the index may no longer accurately depict the market it represents.
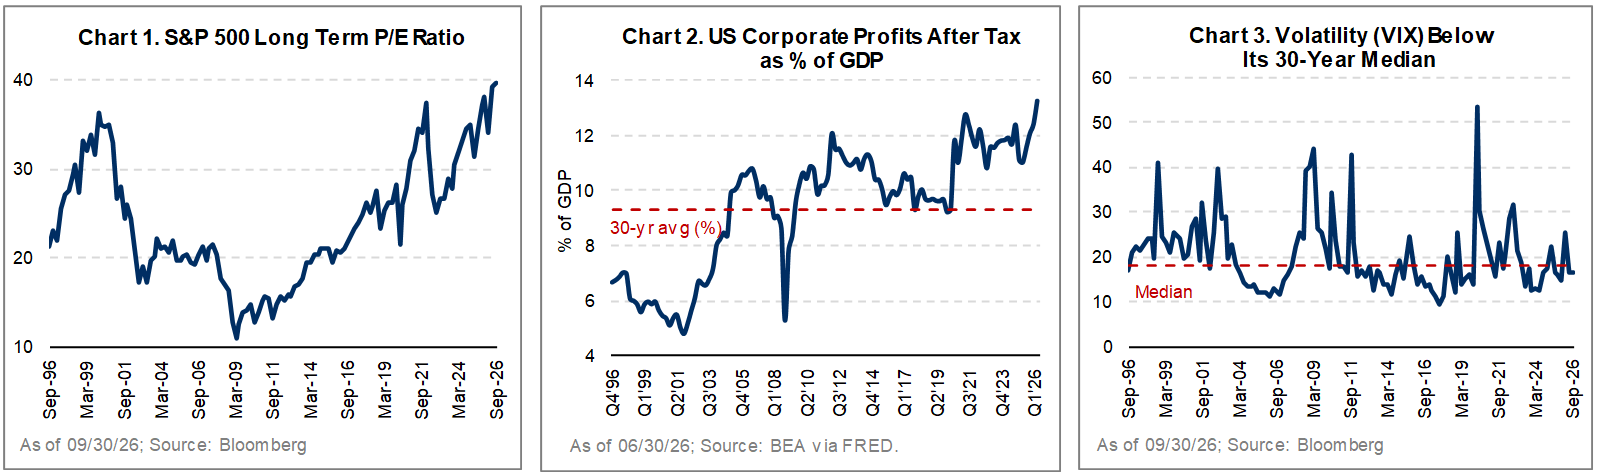
Risk is also building in developed markets. The S&P 500 trades near 40x inflation-adjusted earnings (Chart 1), and US profits as a share of GDP sit at a three-decade high (Chart 2). A cyclically adjusted earnings yield of about 2.5% now competes with a 10-year Treasury yield above 5%. Yet, volatility, as measured by the VIX, sits below its 30-year median (Chart 3), pricing calm just where the margin for error is thinnest.
For EM, the two risks are linked. Much of the AI spending that underpins US valuations is also revenue for EM’s largest semiconductor and hardware companies, so a reversal in developed markets would likely reach EM through its heaviest weights. For investors, an EM allocation today may carry far more technology risk than intended and may be less insulated from US market risk by default. Selectivity and diversification can have a meaningful impact on outcomes.
Resilience: Built in Calm, Tested in Stress
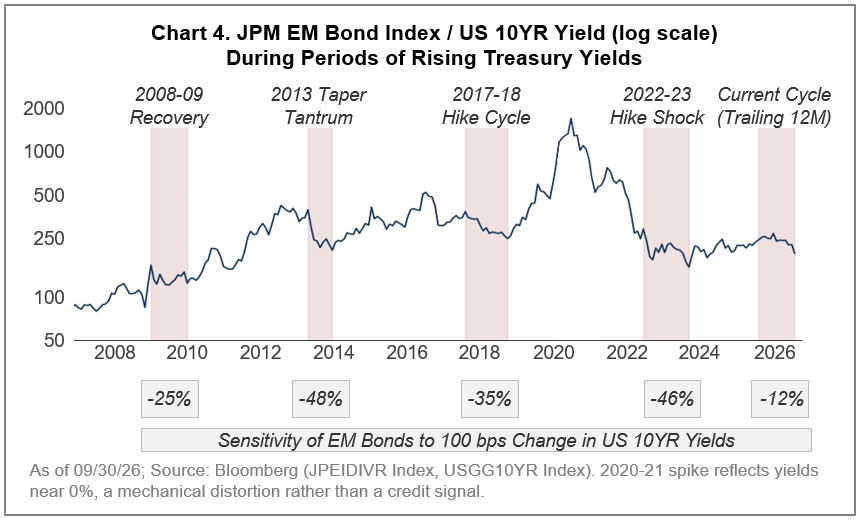
History suggests EM should feel it first. Over the last 20 years, rising Treasury yields reliably hurt EM bonds, currencies, and ultimately equities. This cycle, that reaction function appears to have changed. The sensitivity of EM bonds to a 100 bps rise in US yields has been -12% over the past twelve months, versus a range of -25% to -48% over the four prior cycles (Chart 4). EM equities tell a similar story. Rolling five-year volatility for the MSCI EM Index has run below that of the MSCI World Index for most of the past decade – and it still does.
This resilience has been earned. A new generation of policymakers, tighter fiscal discipline, and more credible institutions have given EM far more control of its destiny. EM central banks moved early. Brazil was first to confront post-COVID inflation, and Vietnam was among the first to ease, while the Fed lagged on both turns. We see the same pattern at the company level. The stronger financial services businesses we highlighted in our 1Q26 letter and the sturdier balance sheets in our 2Q26 letter are two examples.
Prior concentration cycles (Chart 5) offer a lens through which to view current market conditions. In 2008, EM was synonymous with commodities. In 2017, EM equated to China financials and wealth management products. In 2020, it meant investing in Alibaba and Tencent. Each time, consensus views suggested that the theme would persist; instead, a new cycle emerged featuring different countries, different industries, or both. Few leaders stayed at the summit for long.
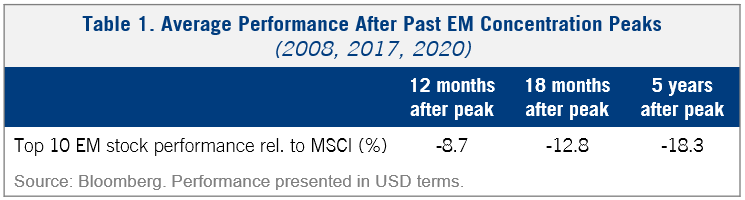
In the periods following each of the aforementioned concentration cycles, when considering the top ten EM stocks at the peak, the average underperformed the index by almost 9% over 12 months, nearly 13% over 18 months, and greater than 18% over five years (Table 1). Our conclusion is not that today’s leaders will certainly fall, but as bottom-up, active stock pickers, we believe that the opportunity set is broader than the benchmark’s heaviest weights.
Opportunity: Found Beyond the Summit
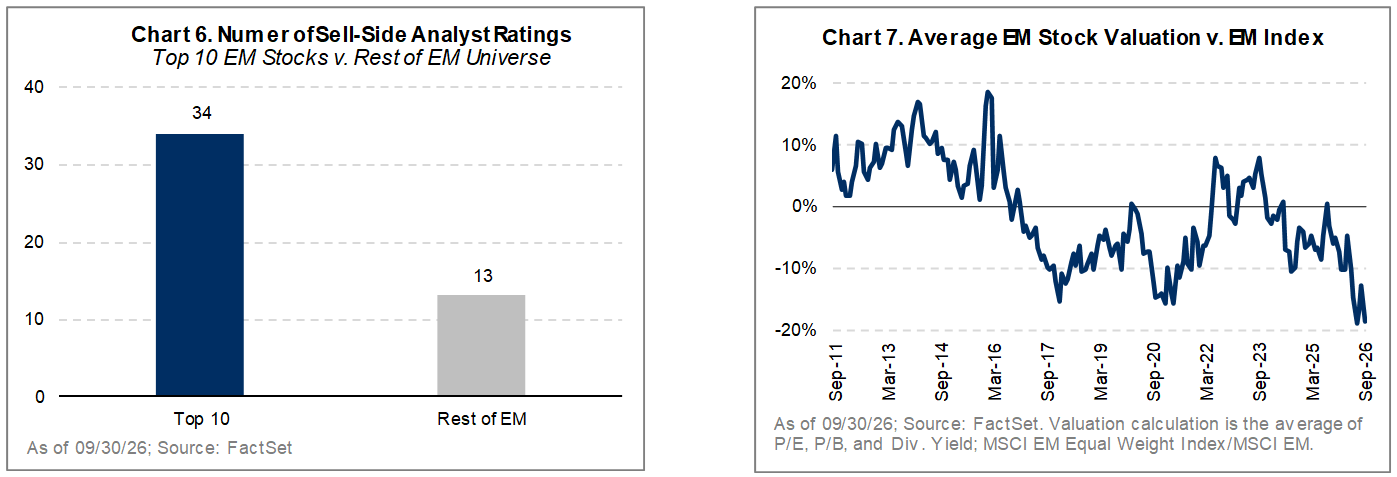
Sell-side analyst attention typically follows index weight. Each of the top ten EM stocks carries an average of 34 analyst ratings; the rest of the EM stocks average 13 (Chart 6). Where coverage thins, mispricing tends to widen. Valuations tell the same story. The average EM stock now trades close to 20% below the index, the widest gap in more than a decade (Chart 7).
Under-covered companies compound quietly and tend to reward investors’ patience, perspective, and disciplined process. The timing and origin of the next rotation are uncertain, as they are rarely visible until after they happen. We will continue to follow our discipline and look for opportunities everywhere (across industries, geographies, and the market cap spectrum), positioning the portfolio to benefit from the drivers of the next cycle before the speed picks up.
Portfolio Positioning
With extensive research travel and our bottom-up process as guides, our portfolio features a diverse array of attractive, undervalued investment opportunities, including those in less popular, non-traditional EM countries and extending across the full market cap spectrum.
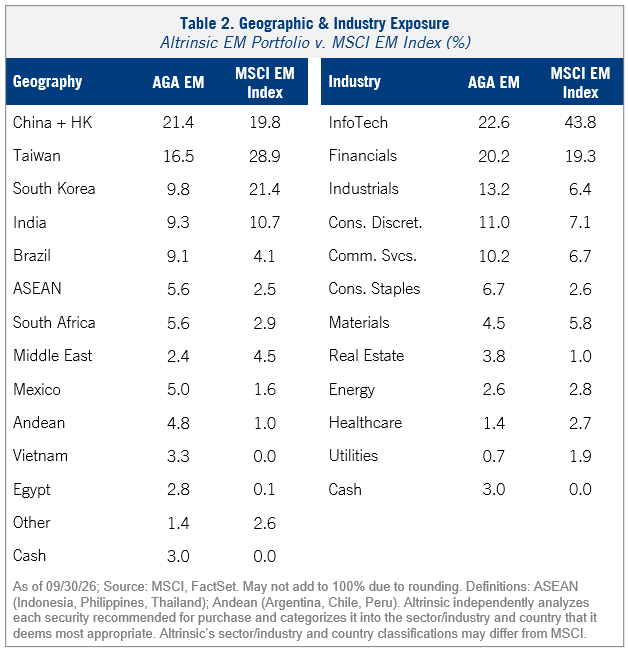
As shown in Table 2, we remain underweight the large, saturated markets of South Korea and Taiwan, largely driven by a notable underweight to the popular tech giants. The portfolio is also underweight India, primarily on valuation grounds. Meanwhile, we have established overweight exposures in parts of Latin America and ASEAN (which feature favorable demographics, rising internal consumption, and attractive valuations), alongside direct frontier exposure in up-and-coming Vietnam.
The overarching EM themes of continued de-coupling from developed markets and improving governance across both countries and companies further support the underappreciated opportunity set for those willing to look beyond the market hype.
Performance Review and Investment Activity
The greatest sources of positive attribution in the third quarter were our holdings in information technology (Lenovo Group, Advantech, Tripod Technology), consumer discretionary (Silicon2, Coway, Americana Restaurants), and industrials (Motiva, GPS Participações, Corporación América Airports), as well as our underweight exposure to tech. Negative attribution came primarily from our positions in financials (Porto Seguro, Sanlam, Commercial International Bank), materials (Ganfeng Lithium, LB Group, Hoa Phat), and health care (Gedeon Richter).
From a geographic perspective, gains in South Korea (Silicon2, Coway, KB Financial Group), Saudi Arabia (Americana Restaurants, Alinma Bank), and Argentina (Corporación América Airports) were offset by our underweight and specific exposure in Taiwan (E Ink, Zhen Ding Technology, Voltronic), South Africa (Sanlam, Clicks Group, Standard Bank Group), and Mexico (Grupo Aeroportuario del Pacífico, Walmex, FEMSA).
Portfolio activity was moderate this quarter, with two buys (Samsung Fire & Marine, Midea Group) and one sell (JD.com).
We took advantage of market volatility and initiated a position in Samsung Fire & Marine Insurance, the leading non-life insurer in South Korea. Business exits, heavy regulation, poor capital allocation, and falling bond yields weighed on ROE for years. Today, new leadership, a better business mix, higher yields, and easing competition offer underappreciated tailwinds. Strong capital and shareholder returns further support outcomes that we do not believe are reflected in the share price.
We also initiated a position in Chinese industrial manufacturer Midea, the world’s largest appliance maker (22% market share in China, 5% overseas). Innovation, efficiency from vertical integration, and a strong management team have driven consistent earnings compounding. We believe the market underestimates the two-thirds of the business exposed to faster-growing international and industrial markets. An improving business mix and a commitment to return 100% of earnings to shareholders support an attractive risk-reward.
We exited our Chinese holding JD.com, as our original thesis (that it was a best-in-class e-commerce operator serving higher-end Chinese consumers) eroded. In pursuit of growth, the company moved into potentially value-destructive businesses, including food delivery, overseas expansion, and online travel. Food delivery subsidies, in particular, threatened to compress margins.
Concluding Remarks
“Notice that the stiffest tree is most easily cracked, while bamboo or willow survives by bending with the wind.”
– Bruce Lee, Bruce Lee: Artist of Life (2015)
A tree that endures has bent many times. Hard years leave narrow rings, and good years wide ones; together they explain the strength of the trunk. Resilience is built ring by ring, and a tree’s strength comes not from how tall it stands, nor from any single ring, but from the full record of years working together as one. Emerging markets are no different – tested by shocks, strengthened by cycles, and more adaptable for it.
The same is true of portfolios. A market that grows tall and rigid on the back of a few leading companies can look strong until the wind shifts, while a portfolio built across many businesses, industries, and countries is better able to adapt when leadership changes, rather than depending on any one theme persisting indefinitely. We aim to build a portfolio of sound balance sheets and durable franchises at prices that compensate us for the risks we take.
Sincerely,
Alice Popescu
Epilogue: On the Psychology of Risk, and Why Process Matters
Risk is as much about behavior as it is arithmetic.
John Coates, a trader turned neuroscientist, describes the winner effect in The Hour Between Dog and Wolf. He argues that success raises testosterone, and testosterone elevates the appetite for risk. Confidence builds on itself until it becomes overconfidence. The reverse holds in losing streaks, when stress hormones make traders shy away from risk just as prices are cheapest. We see a similar effect in markets, as each gain draws more capital to the leaders, and conviction grows as the base beneath it narrows.
Peter Bernstein, author of Against the Gods, spent a career on the history of risk. Probabilities can be debated, while consequences are felt. The useful question is not how likely a reversal is, but what it would cost, especially when confidence and trust are high.
We do not exempt ourselves. Conviction feels the same whether it is right or wrong, which is why we lean on process more than on any single view. A view asks to be trusted. A process asks to be checked, and we would rather be checked.